
Creating a web interface - KeplerGL

In this tutorial, we will look at how to connect the open-sourced KeplerGL project to the Tracking Stream API in a browser.

caution

This tutorial assumes that you are already familiar with the fundamentals of ReactJS and Redux.

Source code#

You can find and download the source code for this example here.

Setting up React#

For the sake of simplicity, we are gonna use the create-react-app utility.

Simply start by the following commands:

npx create-react-app my-app --template redux
cd my-app
npm start

We use the --template redux flag to set up a Redux store in our app, since KeplerGL depends on Redux to work properly. You should now have a React application running at http://localhost:3000.

Setting up KeplerGL#

We can now add KeplerGL to our application:

npm i --save kepler.gl styled-components

In our main App.js file, we can then import at the top

/src/App.js
import KeplerGl from "kepler.gl";

Let's also install react-virtualized, and use its <Autosizer> component which we'll use to dynamically resize our KeplerGL DOM element.

npm i --save react-virtualized

We can now import it, clean up the previous default code, and set up our KeplerGL map component.

/src/App.js
import React from "react";
import KeplerGl from "kepler.gl";
import AutoSizer from "react-virtualized/dist/commonjs/AutoSizer";
import "./App.css";
function App() {
return (
<div className="App">
<div style={{ height: "100vh" }}>
<AutoSizer>
{({ height, width }) => (
<KeplerGl
id="kepler-gl-tutorial"
mapboxApiAccessToken={
// Please get yourself a mapbox token
// https://docs.mapbox.com/help/getting-started/access-tokens/
"your_mapbox_token"
}
width={width}
height={height}
theme={{ tooltipBg: "#1869b5", tooltipColor: "#ffffff" }}
/>
)}
</AutoSizer>
</div>
</div>
);
}
export default App;

To make KeplerGl work, we need to setup the appropriate Redux state manager and middlewares:

src/app/store.js
import { createStore, combineReducers, applyMiddleware, compose } from 'redux';
import keplerGlReducer, { uiStateUpdaters } from "kepler.gl/reducers";
import { enhanceReduxMiddleware } from 'kepler.gl/middleware';
const initialState = {};
const reducers = combineReducers({
keplerGl: keplerGlReducer.initialState({
mapStyle: {
styleType: "light",
},
uiState: {
readOnly: true,
currentModal: null,
mapControls: {
...uiStateUpdaters.DEFAULT_MAP_CONTROLS,
visibleLayers: {
show: false,
},
mapLegend: {
show: true,
active: false,
},
toggle3d: {
show: true,
},
splitMap: {
show: false,
},
mapDraw: {
show: false,
},
mapLocale: {
show: false,
},
},
},
}),
});
const middlewares = enhanceReduxMiddleware([]);
const enhancers = [applyMiddleware(...middlewares)];
export const store = createStore(reducers, initialState, compose(...enhancers));

As you can see, we also did set a several configuration parameters in the initial state of the reducer of KelperGL.

Connecting to the Tracking Stream endpoint#

We can now set up our Tracking Stream API call and data parsing code and then display it with KeplerGL. If you want to learn more about reading streams using the Javascript fetch API, you can find more resources here.

Let start by creating a new function in our component:

src/App.js
import React from "react";
import { addDataToMap } from "kepler.gl/actions";
import { useDispatch, useStore } from 'react-redux'
import KeplerGl from "kepler.gl";
import AutoSizer from "react-virtualized/dist/commonjs/AutoSizer";
import { dataFields, initialConfig } from './keplerConfig'
import "./App.css";
function extractJSON(string) {
const results = string.match(/\{(?:[^{}])*\}/g);
return results || [];
}
function App() {
const dispatch = useDispatch()
const store = useStore()
async function listenToStream() {
dispatch(addDataToMap(initialConfig));
fetch(
`https://api.airsafe.spire.com/v2/targets/stream?compression=none&late_filter=true`,
{
headers: {
Authorization: `Bearer your_token`,
},
}
)
.then(async (response) => {
if (response.status === 401) {
alert("Unauthorized");
}
const stream = response.body.getReader();
// KeplerGL doesn't accept empty rows
// so we have to fill in empty values for each column of the row
const currentData = {
satellite: [["", "", "", "", "", "", "", ""]],
terrestrial: [["", "", "", "", "", "", "", ""]],
};
while (true) {
const { value, done } = await stream.read();
if (done) {
break;
}
try {
extractJSON(new TextDecoder("utf-8").decode(value)).forEach(
(parsed) => {
if (parsed.indexOf("icao_address") > 0) {
const elem = JSON.parse(parsed);
const index = currentData[elem.collection_type].findIndex(
(item) => item[1] === elem.icao_address
);
const newElem = [
elem.timestamp || "",
elem.icao_address || "",
elem.longitude || "",
elem.latitude || "",
elem.altitude_baro || "",
elem.collection_type || "",
elem.flight_number || "",
elem.callsign || "",
];
if (index >= 0) {
currentData[elem.collection_type][index] = newElem;
} else {
currentData[elem.collection_type].push(newElem);
}
}
},
[]
);
if (
currentData.satellite.length > 0 ||
currentData.terrestrial.length > 0
) {
dispatch(addDataToMap({
datasets: [
{
info: {
label: "aircraft_satellite",
id: "spire_aircraft_satellite",
},
data: {
fields: dataFields,
rows: currentData.satellite,
},
},
{
info: {
label: "aircraft_terrestrial",
id: "spire_aircraft_terrestrial",
},
data: {
fields: dataFields,
rows: currentData.terrestrial,
},
},
],
}));
}
} catch (e) {
alert("An error occured while parsing stream results");
}
}
})
.catch((e) => {
alert("An error occured while calling the endpoint");
});
}
return (
<div className="App">
<div style={{ height: "100vh" }}>
<AutoSizer>
{({ height, width }) => (
<KeplerGl
id="kepler-gl-tutorial"
mapboxApiAccessToken={
// Please get yourself a mapbox token
// https://docs.mapbox.com/help/getting-started/access-tokens/
"your_mapbox_token"
}
width={width}
height={height}
theme={{ tooltipBg: "#1869b5", tooltipColor: "#ffffff" }}
store={store}
/>
)}
</AutoSizer>
</div>
</div>
);
}
export default App;

Let's break down what was done here#

  • First, we create a function extractJSON that will extract all the JSON objects contained in the received lines and split them into an array of JSON strings using a Regular expression.
  • Second, we create an async function that calls our endpoint and get a stream reader (using getReader()) from the obtained response.
  • We infinitely loop through our stream reader, reading our values as we go, extracting their JSON content, and replacing old entries sharing the same icao_address, or creating new entries if the icao_address wasn't found.
  • We dispatch the Redux action addDataToMap (using the useDispatch hook) from KeplerGL, updating the Redux store in the process.

Kepler data configuration#

We are almost done with our example, the last thing to do is creating the configuration file imported as keplerConfig. This configuration will indicate to KeplerGL what fields are present in our data, and their specificities such as data types, colors, tooltip options, etc ...

Simply create a new file src/keplerConfig.js, and set the configuration variables:

src/keplerConfig.js
const dataFields = [
{
name: "timestamp",
format: "YYYY-M-D:H:m:sZ",
fieldIdx: 0,
type: "timestamp",
analyzerType: "TIME",
valueAccessor: (values) => values[0],
},
{ name: "icao_address", type: "string", analyzerType: "STRING" },
{ name: "longitude", type: "float", analyzerType: "FLOAT" },
{ name: "latitude", type: "float", analyzerType: "FLOAT" },
{ name: "altitude", type: "float", analyzerType: "FLOAT" },
{ name: "collection_type", type: "string", analyzerType: "STRING" },
{ name: "flight_number", type: "string", analyzerType: "STRING" },
{ name: "callsign", type: "string", analyzerType: "STRING" },
];
const tooltipFields = [
{ name: "timestamp", format: null },
{ name: "latitude", format: null },
{ name: "longitude", format: null },
{ name: "altitude", format: null },
{ name: "icao_address", format: null },
{ name: "collection_type", format: null },
{ name: "flight_number", format: null },
{ name: "callsign", format: null },
];
const initialConfig = {
datasets: [
{
info: {
label: "aircraft_satellite",
id: "spire_aircraft_satellite",
},
data: {
fields: dataFields,
rows: [["", "", "", "", "", "", "", ""]],
},
},
{
info: {
label: "aircraft_terrestrial",
id: "spire_aircraft_terrestrial",
},
data: {
fields: dataFields,
rows: [["", "", "", "", "", "", "", ""]],
},
},
],
config: {
visState: {
layers: [
{
type: "point",
config: {
dataId: "spire_aircraft_satellite",
label: "aircraft_satellite",
highlightColor: [255, 255, 255, 255],
columns: {
lat: "latitude",
lng: "longitude",
altitude: "altitude",
},
color: [210, 32, 32],
visConfig: {
radius: 10,
fixedRadius: false,
opacity: 1,
outline: false,
thickness: 2,
filled: true,
},
isVisible: true,
},
},
{
type: "point",
config: {
dataId: "spire_aircraft_terrestrial",
label: "aircraft_terrestrial",
highlightColor: [255, 255, 255, 255],
columns: {
lat: "latitude",
lng: "longitude",
altitude: "altitude",
},
color: [48, 167, 172],
visConfig: {
radius: 10,
fixedRadius: false,
opacity: 1,
outline: false,
thickness: 2,
filled: true,
},
isVisible: true,
},
},
],
interactionConfig: {
geocoder: false,
tooltip: {
fieldsToShow: {
spire_aircraft_satellite: tooltipFields,
spire_aircraft_terrestrial: tooltipFields,
},
compareMode: true,
compareType: "absolute",
enabled: true,
},
},
},
},
};
export { dataFields, initialConfig };

Let's break down what was done here#

  • We created the dataFields array, which lists the fields that will appear in each Kepler entry, with their respective types.
  • We created the tooltipFields array, which lists which fields will be visible when hovering over a data point.
  • We created the initialConfig object, which details the initial configuration for our Kepler layers and datasets.

Finishing up#

All we need to do now is call our listenToStream() function at render time. We'll do that by adding a useEffect with the parameter [], which will call the function only once on the first render. Also strict mode of react should be prevented because it renders KeplerGL map twice. Make sure your index.js looks like following, you need to remove React.StrictMode component:

src/index.js
import React from 'react';
import { createRoot } from 'react-dom/client';
import { Provider } from 'react-redux';
import { store } from './app/store';
import App from './App';
import reportWebVitals from './reportWebVitals';
import './index.css';
const container = document.getElementById('root');
const root = createRoot(container);
root.render(
<Provider store={store}>
<App />
</Provider>
);
// If you want to start measuring performance in your app, pass a function
// to log results (for example: reportWebVitals(console.log))
// or send to an analytics endpoint. Learn more: https://bit.ly/CRA-vitals
reportWebVitals();
src/App.js
import React, { useEffect } from "react";
import { addDataToMap } from "kepler.gl/actions";
import { useDispatch, useStore } from 'react-redux'
import KeplerGl from "kepler.gl";
import AutoSizer from "react-virtualized/dist/commonjs/AutoSizer";
import { dataFields, initialConfig } from './keplerConfig'
import "./App.css";
function extractJSON(string) {
const results = string.match(/\{(?:[^{}])*\}/g);
return results || [];
}
function App() {
const dispatch = useDispatch()
const store = useStore()
async function listenToStream() {
dispatch(addDataToMap(initialConfig));
fetch(
`https://api.airsafe.spire.com/v2/targets/stream?compression=none&late_filter=true`,
{
headers: {
Authorization: `Bearer your_token`,
},
}
)
.then(async (response) => {
if (response.status === 401) {
alert("Unauthorized");
}
const stream = response.body.getReader();
// KeplerGL doesn't accept empty rows
// so we have to fill in empty values for each column of the row
const currentData = {
satellite: [["", "", "", "", "", "", "", ""]],
terrestrial: [["", "", "", "", "", "", "", ""]],
};
while (true) {
const { value, done } = await stream.read();
if (done) {
break;
}
try {
extractJSON(new TextDecoder("utf-8").decode(value)).forEach(
(parsed) => {
if (parsed.indexOf("icao_address") > 0) {
const elem = JSON.parse(parsed);
const index = currentData[elem.collection_type].findIndex(
(item) => item[1] === elem.icao_address
);
const newElem = [
elem.timestamp || "",
elem.icao_address || "",
elem.longitude || "",
elem.latitude || "",
elem.altitude_baro || "",
elem.collection_type || "",
elem.flight_number || "",
elem.callsign || "",
];
if (index >= 0) {
currentData[elem.collection_type][index] = newElem;
} else {
currentData[elem.collection_type].push(newElem);
}
}
},
[]
);
if (
currentData.satellite.length > 0 ||
currentData.terrestrial.length > 0
) {
props.addDataToMap({
datasets: [
{
info: {
label: "aircraft_satellite",
id: "spire_aircraft_satellite",
},
data: {
fields: dataFields,
rows: currentData.satellite,
},
},
{
info: {
label: "aircraft_terrestrial",
id: "spire_aircraft_terrestrial",
},
data: {
fields: dataFields,
rows: currentData.terrestrial,
},
},
],
});
}
} catch (e) {
alert("An error occured while parsing stream results");
}
}
})
.catch((e) => {
alert("An error occured while calling the endpoint");
});
}
useEffect(() => {
listenToStream()
}, []);
return (
<div className="App">
<div style={{ height: "100vh" }}>
<AutoSizer>
{({ height, width }) => (
<KeplerGl
id="kepler-gl-tutorial"
mapboxApiAccessToken={
// Please get yourself a mapbox token
// https://docs.mapbox.com/help/getting-started/access-tokens/
"your_mapbox_token"
}
width={width}
height={height}
theme={{ tooltipBg: "#1869b5", tooltipColor: "#ffffff" }}
store={store}
/>
)}
</AutoSizer>
</div>
</div>
);
}
export default App;

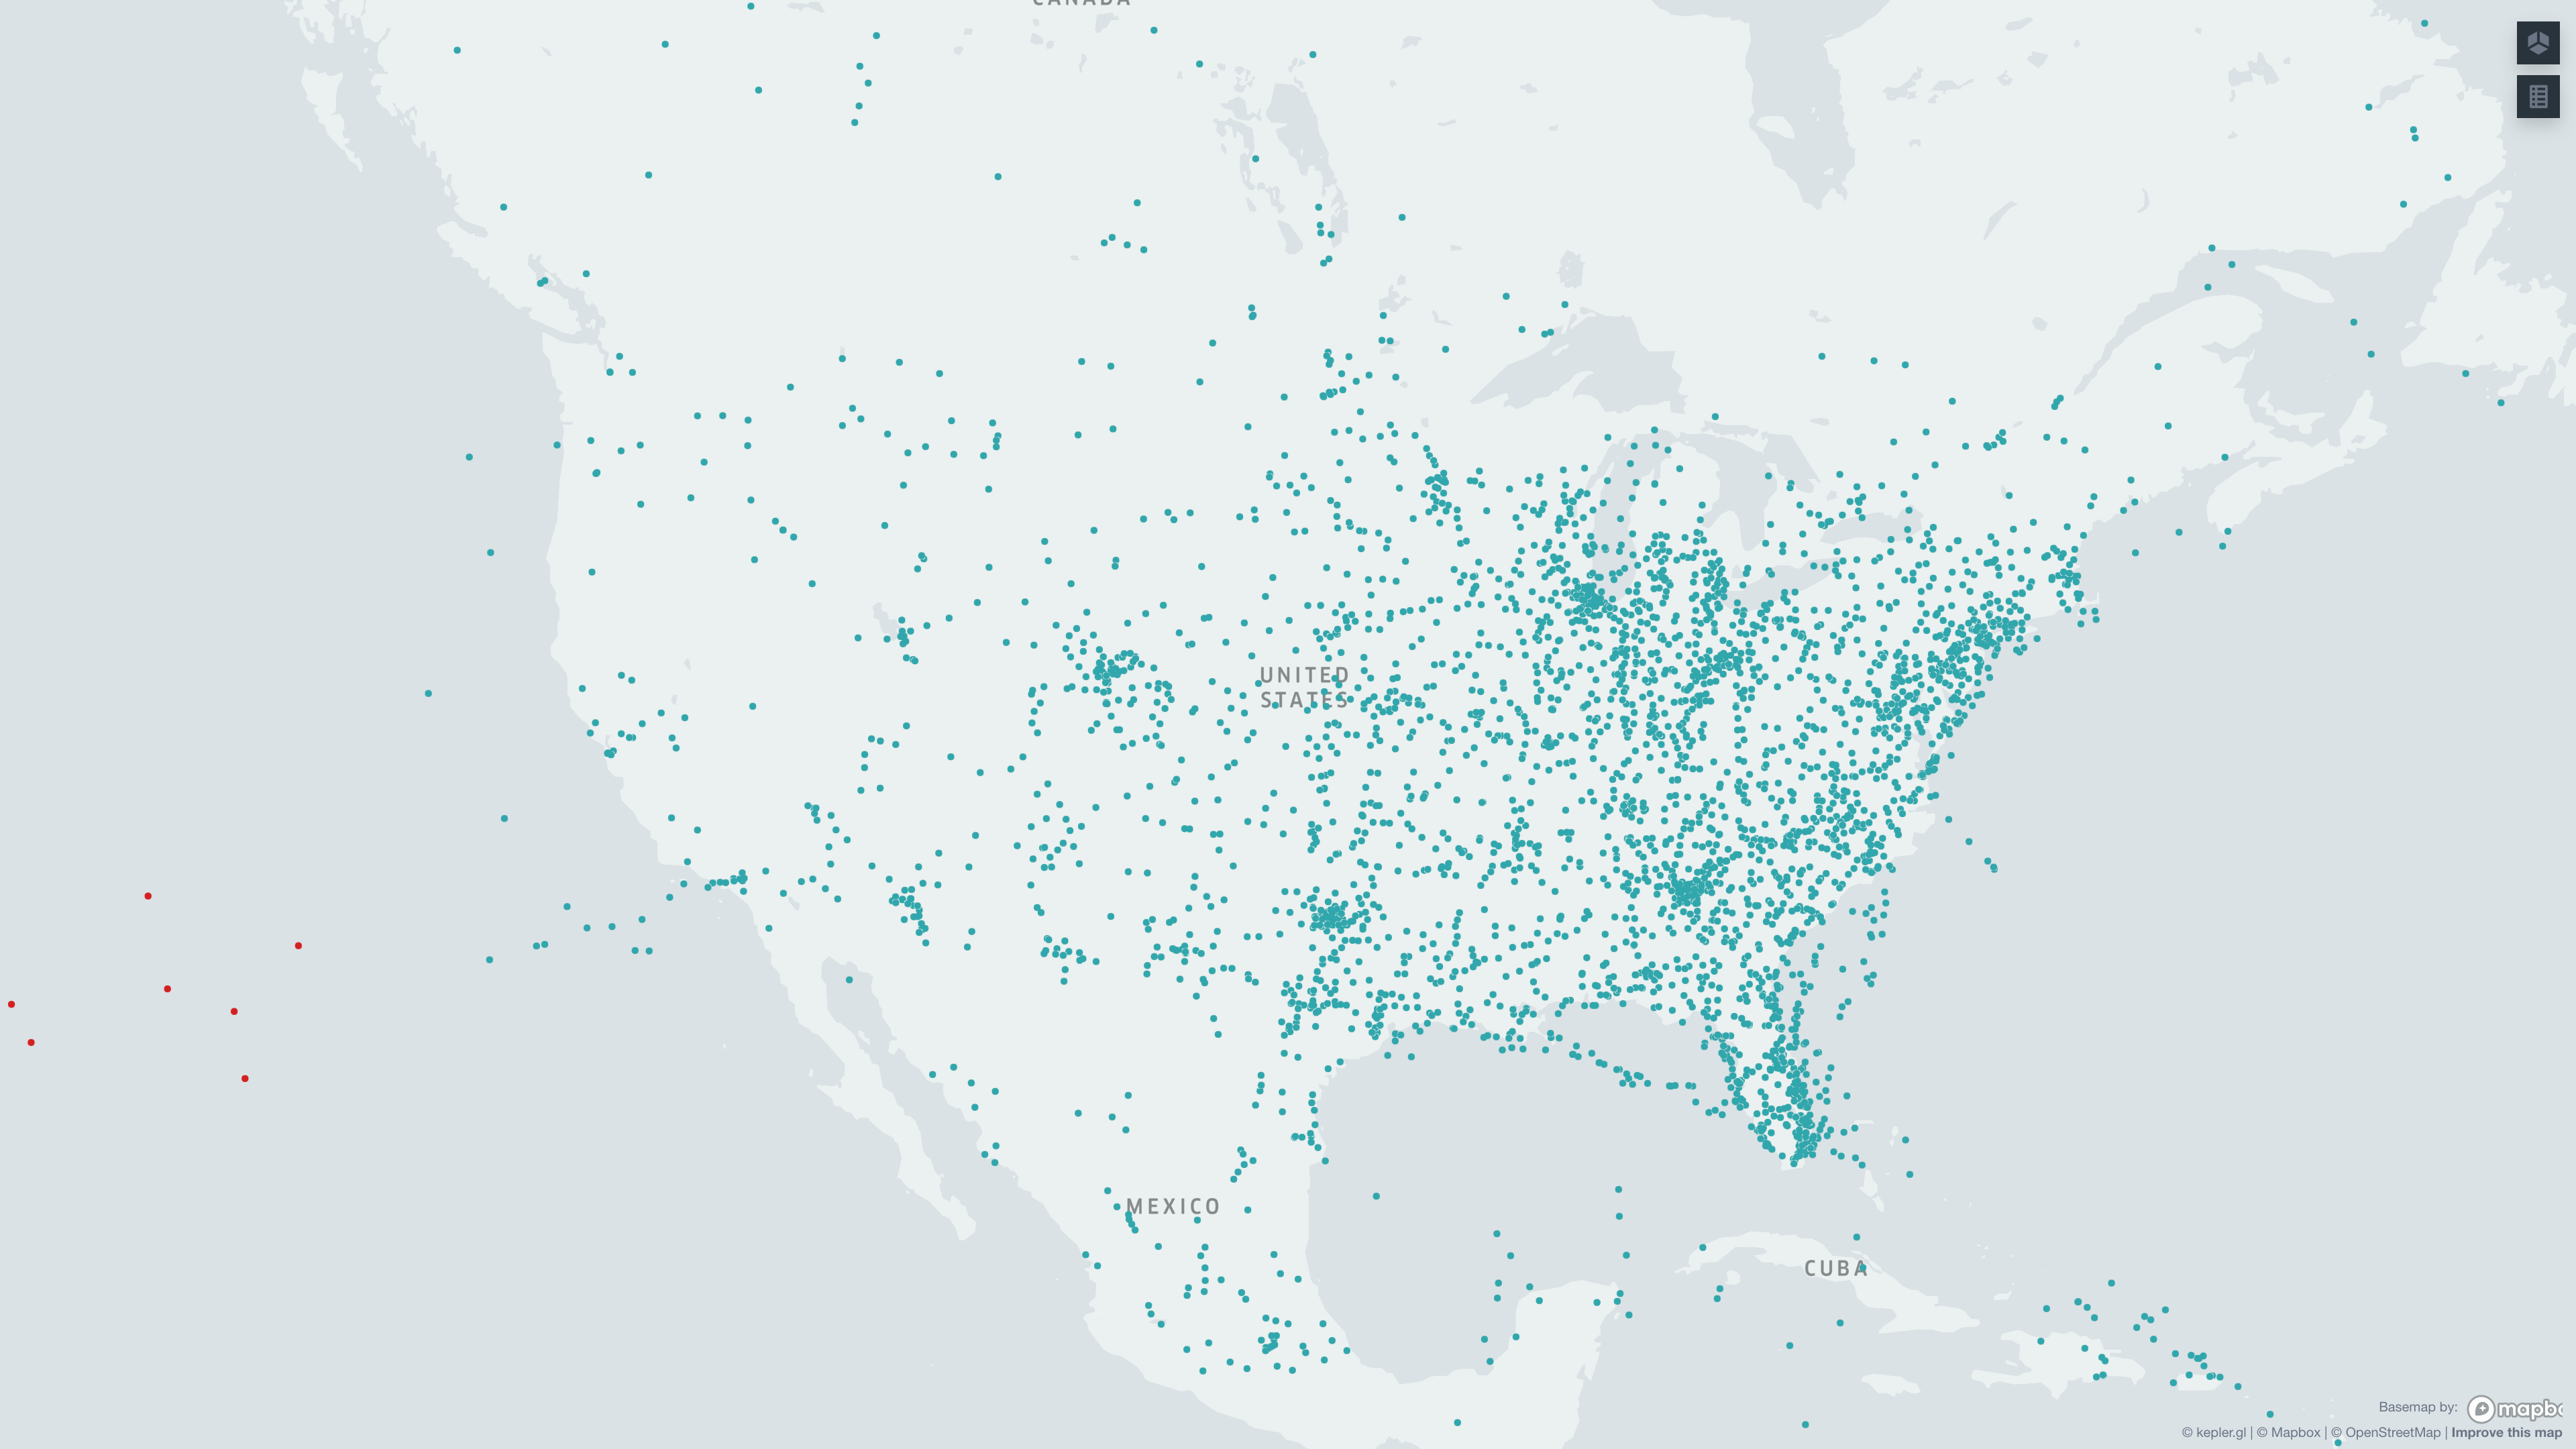
🎉 We now have a basic functional example of a KeplerGL map displaying the Tracking Stream data. For reference, it should look like that:

Earth map with data points
Next steps

We could improve that example by adding a button to close/open the connection, display some statistics about what is currently being displayed among many other possible improvements.